Difference between revisions of "Climate and Land Use Research"
| (2 intermediate revisions by the same user not shown) | |||
| Line 1: | Line 1: | ||
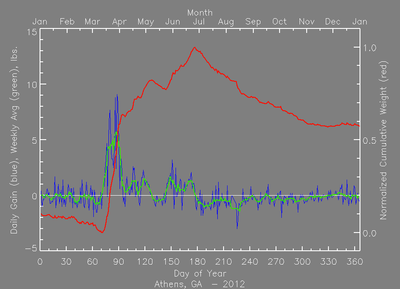
| − | + | [[File:Athens,GA plot.png|thumb|400px|right|2012 Nectar Flow GA003 Athens, Georgia, USA]] | |
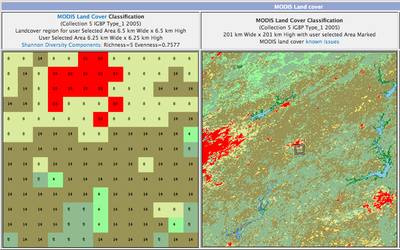
| + | [[File:Athens LC V5.png|thumb|400px|right|MODIS Land Cover GA003 Athens, Georgia, USA]] | ||
| + | At [http://honeybeenet.gsfc.nasa.gov/ NASA's Honey Bee Net] plant/pollinator interaction (necar flows) are used to measure the performance of the environment, instead of the performance of individual hives. Since the 1970's NASA volunteers have been measuring plant/pollinator interaction to help correlate satellite imagery with what is happening on the ground. | ||
| + | |||
| + | The data is carefully checked for accuracy and assigned a quality score. NASA's data from Maryland indicates that the peak nectar flow occurs nearly 4 weeks earlier than in 1970's. | ||
Hivetool's Data Download program allows easy downloads in NASA's data format. | Hivetool's Data Download program allows easy downloads in NASA's data format. | ||
| − | |||
| − | |||
Latest revision as of 08:58, 19 April 2015
At NASA's Honey Bee Net plant/pollinator interaction (necar flows) are used to measure the performance of the environment, instead of the performance of individual hives. Since the 1970's NASA volunteers have been measuring plant/pollinator interaction to help correlate satellite imagery with what is happening on the ground.
The data is carefully checked for accuracy and assigned a quality score. NASA's data from Maryland indicates that the peak nectar flow occurs nearly 4 weeks earlier than in 1970's.
Hivetool's Data Download program allows easy downloads in NASA's data format.

