Difference between revisions of "Hive Management"
(→Pollen Flow) |
(→Pollen Flow) |
||
| Line 89: | Line 89: | ||
{| class="wikitable" style="vertical-align:top;" | {| class="wikitable" style="vertical-align:top;" | ||
|- | |- | ||
| − | + | !style="width: 250px;|Right: No bees were seen on on goldenrod.<br><br>Below: Numerous bees were observed on lambs quarter: | |
| − | + | !style="width: 250px;||[[File:goldenrod1_250.jpg]] | |
| − | + | !style="width: 250px;||[[File:goldenrod2_234.jpg]] | |
|- | |- | ||
|[[File:lambsquarter1_300.jpg|250px]] | |[[File:lambsquarter1_300.jpg|250px]] | ||
Revision as of 06:11, 20 December 2013
Knowing what is happening in the hive is crucial to proper hive management. By knowing the beginning, end, and quantity of nectar flows, bee keepers can determine when to add and remove supers, when to move hives and where to locate hives to maximize honey production. By knowing the amount of young bees engaged in playflight, it is possible to calculate the strength of the hive and egg laying ability of the queen.
Below are graphs (weight and temperature signatures) of hive activity and their possible interpretations.
Orientation or Play Flight
|
Data Log
|
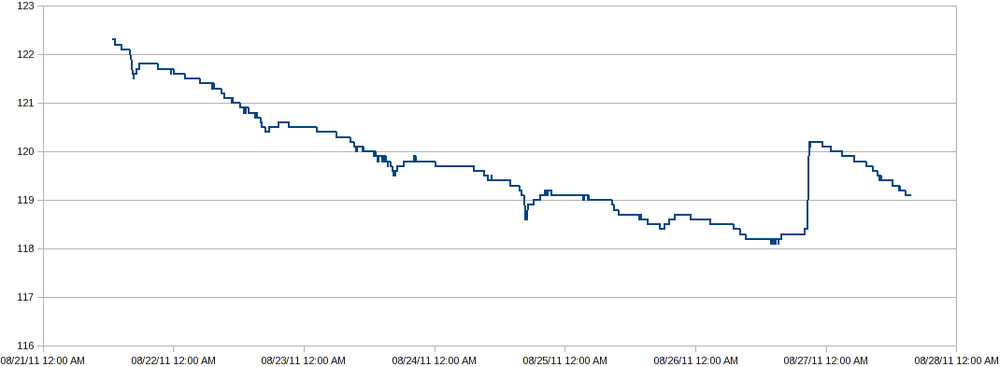
At 4:30 pm on August 21st, 2011, a sudden drop in hive weight, at times as much as .1 lb per 5 minutes, was noticed. From the weight loss, here 0.6 lbs (122.1 - 121.5), a rough estimate of the number of bees engaging in playflight can be calculated. Assuming 3000 bees per pound, approximately 1800 bees were flying (0.6 lb x 3000 bees/lb). This behavior was observed for 5 consecutive days until it rained. By knowing the amount of young bees engaged in playflight, it should be possible to calculate the strength of the hive and egg laying ability of the queen. |
Playflight Trigger
Pollen Flow
| Data Log
|
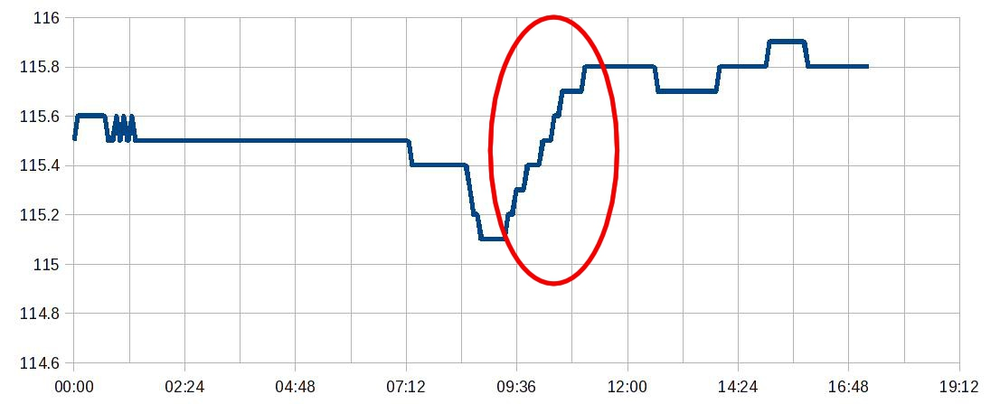
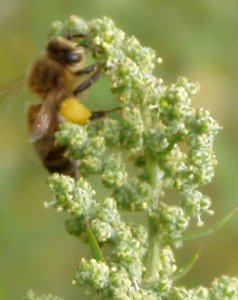
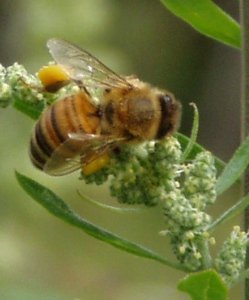
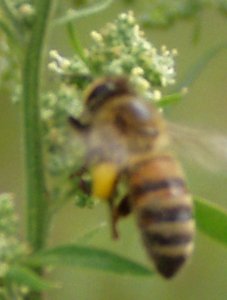
A rapid rise in hive weight was noted from 9:15 am to 11:15 am on 9/4/2011. The bees left the hive around 8 am and quickly began returning loaded with pollen. Notice that the pollen stopped coming in before noon and there was no weight loss in the afternoon due to evaporation (it was not nectar). Most of the bees landing at the hive were loaded with bright yellow pollen. |
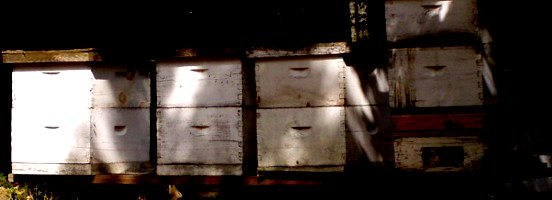
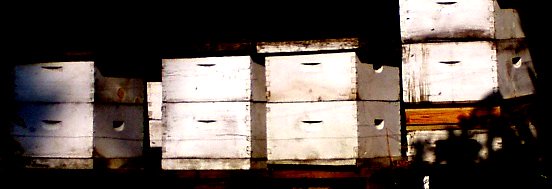
| Right: No bees were seen on on goldenrod. Below: Numerous bees were observed on lambs quarter: |
style="width: 250px; | 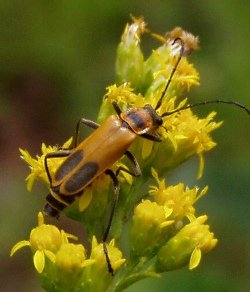
|
style="width: 250px; | 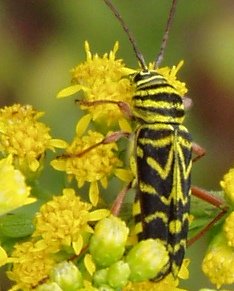
|
|---|---|---|---|---|
|
|
|
Brood Chamber Temperatures
Fall Die Off
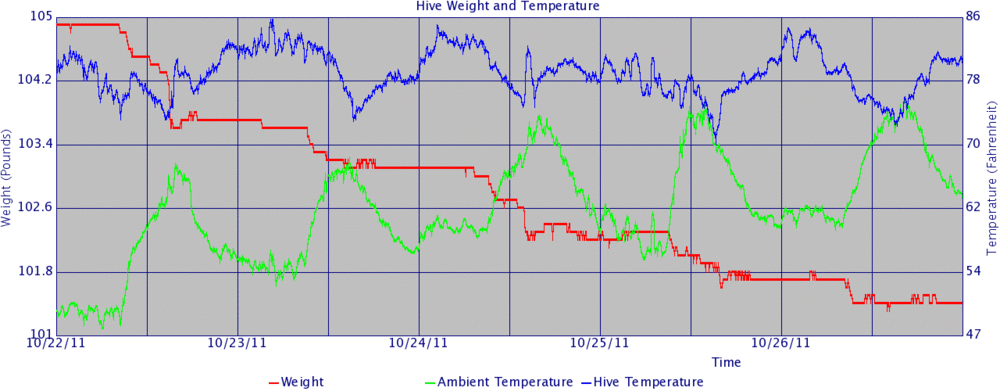
I'm calling this "Fall Die Off" for a lack of a better understanding of what is going on. Note that the brood temperature has dropped to 85 degrees from 95 degrees.
In the graph below, courtesy of Dr. Wayne Esaias, GSFC, NASA, it is referred to as "They left and didn't come back".
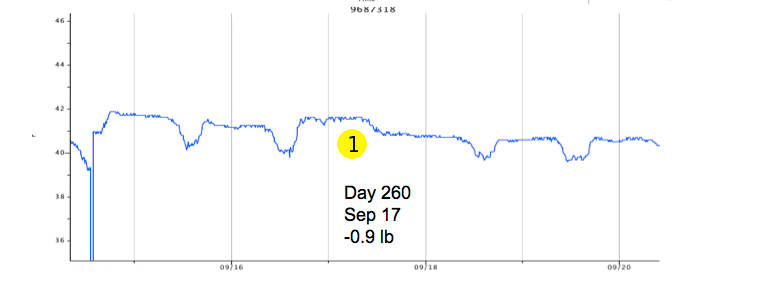 Possibilities:
- Death of bees maybe due to pesticides.
- Death of 'summer bee' foragers that get carted away (death might occur mostly during cold nights)
- Fall drone massacre/death
- Robbing (lots of chronic, sneaky, petty larceny this time of yr)
- Hive drying out during daytime (usually Sept nights here are very humid, lots of dew, not good for drying)
- Something else
